In the world of modern web applications, understanding and optimizing performance is crucial. Frappe, the powerful open-source framework, can significantly benefit from robust Application Performance Monitoring (APM). In this article, we'll explore how to implement APM using OpenTelemetry and Jaeger, providing deep insights into your application's performance and behavior.
Why APM Matters for Frappe Applications
Before diving into implementation, let’s understand why APM is essential:
-
Performance Insights: Gain granular visibility into request lifecycles, database queries, and external service calls.
-
Bottleneck Detection: Quickly identify and resolve performance bottlenecks.
-
Distributed Tracing: Track requests across multiple services and microservices.
-
Resource Optimization: Make data-driven decisions about scaling and resource allocation.
1. Docker Compose Configuration
First, we’ll set up Jaeger as our tracing backend. Here’s a sample Docker Compose configuration:
jaeger:
  image: jaegertracing/all-in-one:1.62.0
  ports:
    - 16686:16686
  environment:
    - COLLECTOR_ZIPKIN_HOST_PORT=:9411
    - COLLECTOR_OTLP_ENABLED=true
This configuration:
-
Uses the latest Jaeger all-in-one image
-
Exposes the Jaeger UI on port 16686
-
Enables OpenTelemetry Protocol (OTLP) collector
2. Instrumenting Gunicorn with OpenTelemetry
Here’s how to instrument your Frappe application’s Gunicorn server:
OTEL_EXPORTER_OTLP_TRACES_INSECURE=true \
OTEL_EXPORTER_OTLP_ENDPOINT=jaeger:4317 \
OTEL_RESOURCE_ATTRIBUTES=service.name=client-sites-gunicorn \
/workspace/development/frappe-bench/env/bin/opentelemetry-instrument \
    /workspace/development/frappe-bench/env/bin/gunicorn \
    --chdir=/workspace/development/frappe-bench/sites \
    --bind=0.0.0.0:8000 \
    --threads=4 \
    --workers=2 \
    --log-level=debug \
    --worker-class=gthread \
    --worker-tmp-dir=/dev/shm \
    --timeout=120 \
    --preload \
    frappe_utils.app
Key OpenTelemetry configuration points:
-
OTEL_EXPORTER_OTLP_TRACES_INSECURE=true: Allows insecure (non-TLS) connections -
OTEL_EXPORTER_OTLP_ENDPOINT=jaeger:4317: Points to Jaeger's OTLP endpoint -
OTEL_RESOURCE_ATTRIBUTES=service.name=client-sites-gunicorn: Sets a meaningful service name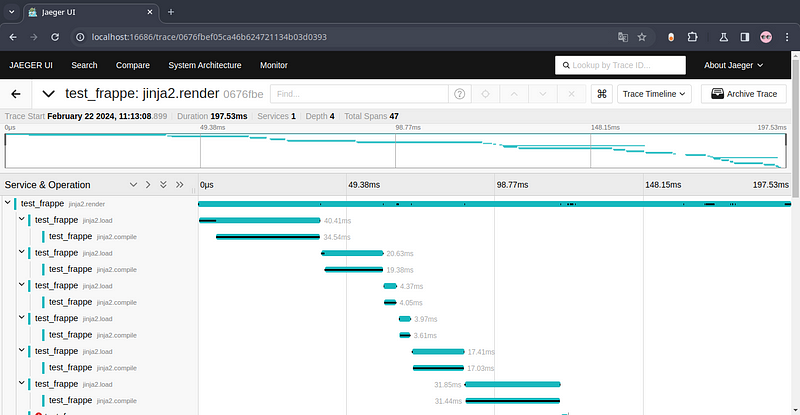
Modifying Frappe Commands for Tracing
When creating new sites or performing administrative tasks, you can modify commands to include tracing:
opentelemetry-instrument frappe new-site \
    --no-mariadb-socket \
    --admin-password=admin \
    --force \
    your_site_name
Best Practices and Considerations
-
Performance Overhead: While OpenTelemetry adds minimal overhead, monitor its impact on your specific use case.
-
Sensitive Data: Be cautious about trace data and implement appropriate filtering.
-
Environment-Specific Configuration: Utilize distinct tracing configurations for development, staging, and production environments.
Advanced Tracing Techniques
Custom Instrumentation
Frappe’s Python-based architecture allows for custom trace spans:
from opentelemetry import trace
tracer = trace.get_tracer(__name__)
def custom_method():
    with tracer.start_as_current_span("custom_operation"):
        # Your custom logic here
        pass
Sampling and Performance
Configure sampling to balance between comprehensive tracing and performance:
from opentelemetry.sdk.trace import TracerProvider
from opentelemetry.sdk.trace.export import BatchSpanProcessor
trace.set_tracer_provider(TracerProvider(
    sampler=trace.sampling.ParentBasedTraceIdRatio(0.1)  # 10% sampling
))
Conclusion
Implementing APM in Frappe using OpenTelemetry and Jaeger transforms your observability strategy. By following these steps, you’ll gain unprecedented insights into your application’s performance, helping you build more robust and efficient web applications.
Next Steps
-
Experiment with different OpenTelemetry configurations
-
Set up alerts based on trace data
-
Continuously monitor and optimize your application’s performance Happy tracing! 🚀📊
© Copyright 2026. All Rights Reserved.